1. 直方图
统计每个像素点有多少个

cv2.calcHist(images, channels, mask, histSize, ranges)
- images:原图,格式为uint8或float32,传入函数时须带中括号 [img]
- channels:统幅图像的直方图,入度图为灰度图时值为:[0],彩色图像时值为0[2]
- mask:掩模图像,统整幅图像的直方图时值为None,统一部分时使用自定义的掩模图像
- histSize:BIN的数目,如:[0-10] [11-20] 等等
- ranges:像素值范围,如:[0, 256]
import cv2 # OpenCV 读取的格式是 BGR
import matplotlib.pyplot as plt
import numpy as np
%matplotlib inline

# 灰度图
img = cv2.imread('ysg.png', 0)
hist = cv2.calcHist([img], [0], None, [256], [0, 256])
hist.shape

(256, 1)
plt.hist(img.ravel(), 256)
plt.show()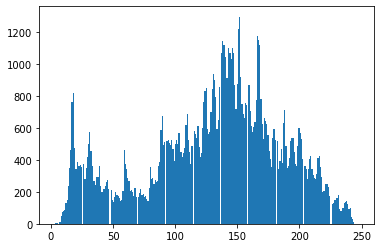
# 彩色图
img = cv2.imread('ysg.png')
color = ('b', 'g', 'r')
for i, col in enumerate(color):
hist = cv2.calcHist([img], [i], None, [256], [0, 256])
plt.plot(hist, color = col)
plt.xlim([0, 256])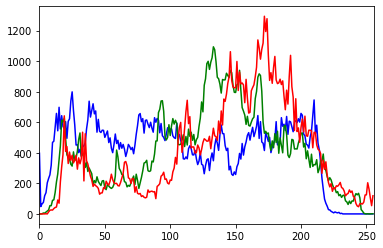
mask操作
img = cv2.imread('ysg.png', 0)
# 创建mask
mask = np.zeros(img.shape[:2], np.uint8)
# 掩模图像区域(需要取的地方设置为白色)
mask[100:300, 100:400] = 255
masked_img = cv2.bitwise_and(img, img, mask=mask)
hist_full = cv2.calcHist([img], [0], None, [256], [0, 256])
hist_mask = cv2.calcHist([img], [0], mask, [256], [0, 256])
plt.subplot(221), plt.imshow(img, 'gray')
plt.subplot(222), plt.imshow(mask, 'gray')
plt.subplot(223), plt.imshow(masked_img, 'gray')
plt.subplot(224), plt.plot(hist_full), plt.plot(hist_mask)
plt.xlim([0, 256])
plt.show()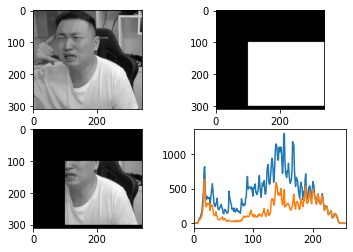
2. 直方图均衡化
img = cv2.imread('ysg.png', 0)
plt.hist(img.ravel(), 256)
plt.show()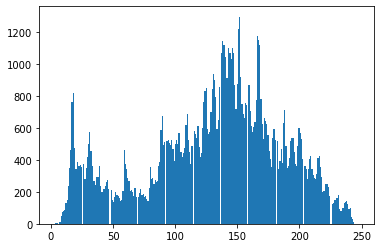
plt.imshow(img, 'gray')
plt.show()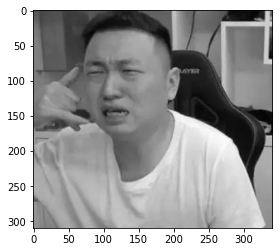
# 均衡化
equ = cv2.equalizeHist(img)
plt.hist(equ.ravel(), 256)
plt.show()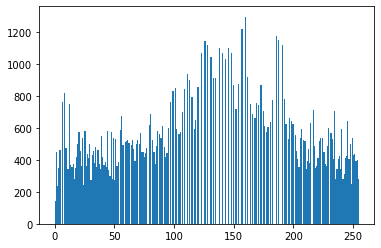
plt.imshow(equ, 'gray')
plt.show()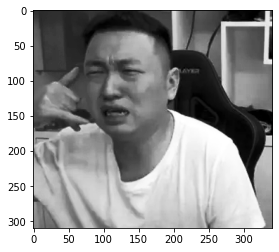
# 自适应直方图均衡化
clahe = cv2.createCLAHE(clipLimit=2.0, tileGridSize=(1, 1))
img_clahe = clahe.apply(img)
plt.imshow(img_clahe, 'gray')
plt.show()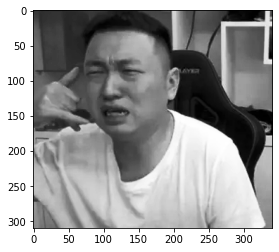
3. 傅里叶变换
(1)傅里叶变换的作用
- 高频:变化剧烈的灰度分量,如:边界
- 低频:变化缓慢的灰度分量,如:大海
(2)滤波
- 低通滤波器:只保留低频,会使图像模糊
- 高通滤波器:只保留高频,会使图像的细节增强
(3)OpenCV cv2.dft()/cv2.idft()
- 输入的图像需要先转换为 np.float32 格式
- 输出结果中频率为0的部分会在左上角,通常需转换到中心位置(通过 shift 变换实现)
- cv2.dft()返回结果是双通道的(实部、虚部),需转换为图像格式才能展示(0, 255)
img = cv2.imread('ysg.png', 0)
img_float32 = np.float32(img)

dft = cv2.dft(img_float32, flags=cv2.DFT_COMPLEX_OUTPUT)
dft_shift = np.fft.fftshift(dft)

# 转换为灰度图能表示的形式
magnitued_spectrum = 20 * np.log(cv2.magnitude(dft_shift[:,:,0], dft_shift[:,:,1]))

plt.subplot(121), plt.imshow(img, cmap='gray')
plt.title('Input Image'), plt.xticks([]), plt.yticks([])
plt.subplot(122), plt.imshow(magnitued_spectrum, cmap='gray')
plt.title('Magnitued Spectrum'), plt.xticks([]), plt.yticks([])
plt.show()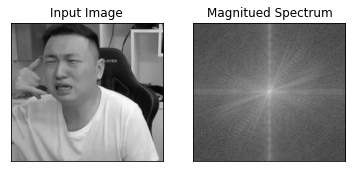
# 低通滤波器
img = cv2.imread('ysg.png', 0)
img_float32 = np.float32(img)

dft = cv2.dft(img_float32, flags=cv2.DFT_COMPLEX_OUTPUT)
dft_shift = np.fft.fftshift(dft)

rows, cols = img.shape
# 中心位置
crow, ccol = int(rows/2), int(cols/2)

mask = np.zeros((rows, cols, 2), np.uint8)
mask[crow - 30 : crow + 30, ccol - 30 : ccol + 30] = 1

# IDFT
fshift = dft_shift * mask
f_ishift = np.fft.ifftshift(fshift)
img_back = cv2.idft(f_ishift)
img_back = cv2.magnitude(img_back[:,:,0], img_back[:,:,1])

plt.subplot(121), plt.imshow(img, cmap='gray')
plt.title('Input Image'), plt.xticks([]), plt.yticks([])
plt.subplot(122), plt.imshow(img_back, cmap='gray')
plt.title('Result'), plt.xticks([]), plt.yticks([])
plt.show()
# 高通滤波器
img = cv2.imread('ysg.png', 0)
img_float32 = np.float32(img)

dft = cv2.dft(img_float32, flags=cv2.DFT_COMPLEX_OUTPUT)
dft_shift = np.fft.fftshift(dft)

rows, cols = img.shape
# 中心位置
crow, ccol = int(rows/2), int(cols/2)

mask = np.ones((rows, cols, 2), np.uint8)
mask[crow - 30 : crow + 30, ccol - 30 : ccol + 30] = 0

# IDFT
fshift = dft_shift * mask
f_ishift = np.fft.ifftshift(fshift)
img_back = cv2.idft(f_ishift)
img_back = cv2.magnitude(img_back[:,:,0], img_back[:,:,1])

plt.subplot(121), plt.imshow(img, cmap='gray')
plt.title('Input Image'), plt.xticks([]), plt.yticks([])
plt.subplot(122), plt.imshow(img_back, cmap='gray')
plt.title('Result'), plt.xticks([]), plt.yticks([])
plt.show()



评论 (0)